
Getting clean data is hard enough, but sometimes, you need more than clean data. Just like in a house or an apartment, pushing the clutter into the closet doesn't make it go away. You need to tidy your data.
It's one thing to have tabular data with nice columns and logical rows. It's another to have data that is ready for analysis. Tidy data is data that is ready for analysis. It's data that is organized in a way that makes it easy to work with, and it is easy to manipulate, visualize, and model. Tidy data is data that is easy to use.
What is tidy data?
The tidy data concept was introduced by Hadley Wickham in his 2014 paper, Tidy Data. And it still rings true today.
Simply put, tidy data a dataset where:
- Each variable forms a column.
- Each observation forms a row.
- Each type of observational unit forms a table.
Althought this structure is not always necessary for high quality analysis, it can often make big difference in the ease of analysis.
Tidy data in crul
The defacto data format in crul is the table, and the query language makes it easy to normalize (similar to flattening), rename, table, and untable data dynamically. Other common operations like joining and appending are also possible.
Often to get tiny data you'll need to "melt" your columns. This is where crul's new melt command shines. More on this shortly, but first, what does it mean to "melt" data?
Melting data
Melting data is the process of taking columns and turning them into rows. This is often necessary when you have a dataset that has multiple columns that represent the same thing. For example, if you have a dataset that has a column for each year, you might want to melt the data so that you have a single column for the year and a single column for the value.
Data prior to melting:
| song | artist | 2019 | 2020 | 2021 | 2022 | 2023 |
|---|---|---|---|---|---|---|
| song1 | artist1 | 100 | 200 | 300 | 400 | 500 |
| song2 | artist2 | 200 | 300 | 400 | 500 | 600 |
| song3 | artist3 | 300 | 400 | 500 | 600 | 700 |
Data after melting:
| song | artist | year | plays |
|---|---|---|---|
| song1 | artist1 | 2019 | 100 |
| song1 | artist1 | 2020 | 200 |
| song1 | artist1 | 2021 | 300 |
| ... | ... | ... | ... |
| song1 | artist2 | 2022 | 500 |
| ... | ... | ... | ... |
| song3 | artist3 | 2023 | 700 |
By melting the data, you can now easily analyze the data by year. You can also easily visualize the data by year. And you can easily model the data by year.
Melting data in crul
The melt command in crul makes it easy to melt data. It takes a list of columns to melt. It then melts the data in those columns, and keeps the rest. You can then rename the columns to whatever you want, and continue processing, download as a csv or json file, or push to a third party store (like an S3 bucket).
Let's see an example of melting the data from the previous example.
We'll assume our data is in a file called plays.csv that we have uploaded to the cellar. It will be the same as the data in the previous example.
thaw plays.csv
|| melt 2019 2020 2021 2022 2023
|| rename column year
You can also provide wildcards to the melt command. For example, if you wanted to melt all columns that start with 20, you could do the following:
thaw plays.csv
|| melt 20*
|| rename column year
More examples from the tidy data paper
Let's take two examples from tidy data paper and see how we can melt the data in crul.
Example 1: Billboard top 100
We'll start with the billboard charts dataset from the tidy data paper. You can find the dataset here.
We'll first upload that csv to the cellar so we can thaw it into our pipeline.
thaw billboard.csv
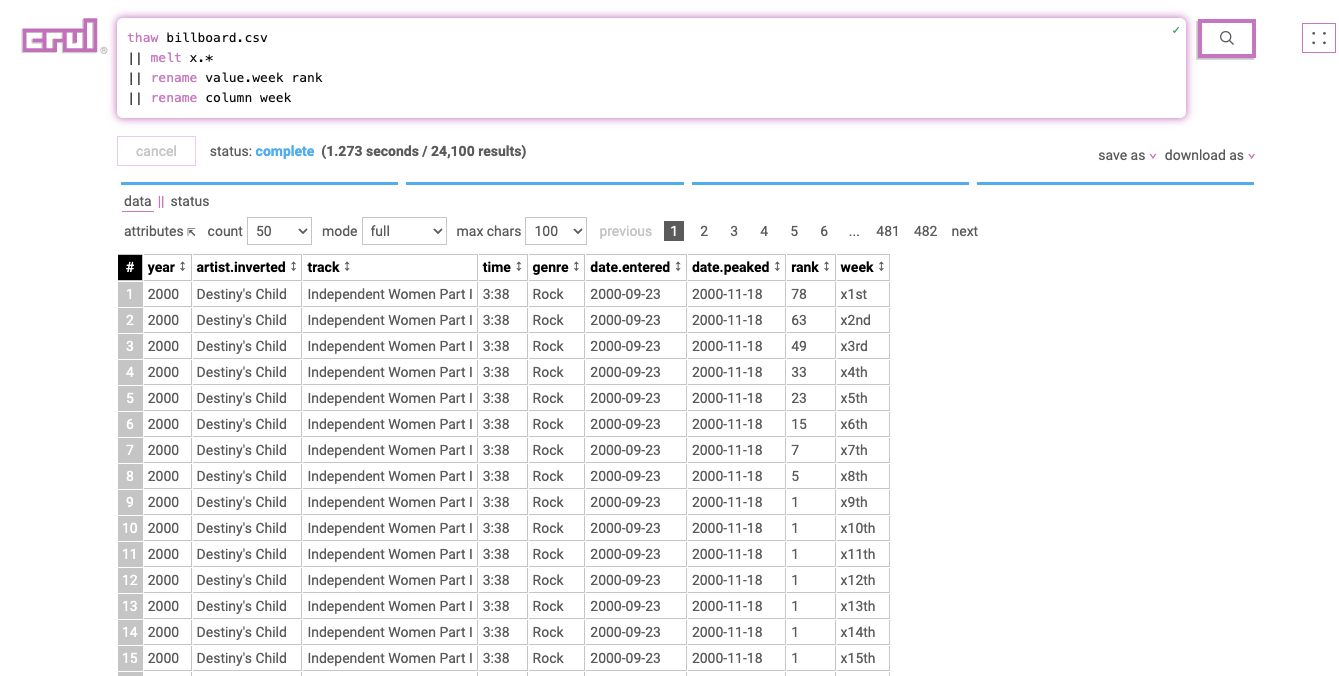
Notice that we have observations in our columns, specifically the billboard rank at different weeks in columns x1st.week, x2nd.week, etc. This is not tidy!
Let's melt all columns that fit the regex pattern x.* (x1st.week, x2nd.week, etc.).
thaw billboard.csv
|| melt x.*
|| rename value.week rank
|| rename column week
From here we can do a little more cleanup and renaming of columns, construct timestamps, or process otherwise, but our data is now effectively "molten".
Example 2: Tuberculosis
thaw tb.csv
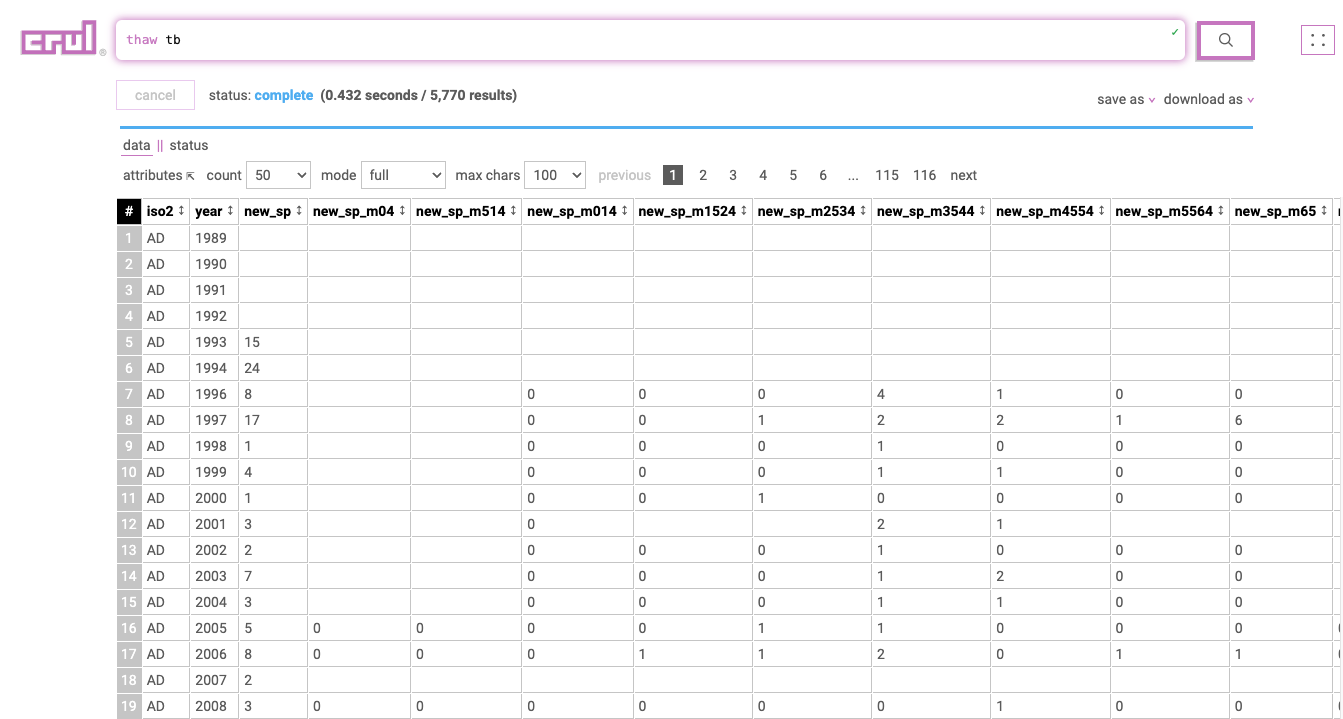
Notice that we have observations in our columns, specifically the number of cases for different categories/dates in columns new_sp_m04, new_sp_m514, etc. This is not tidy!
Let's melt all columns that fit the regex pattern new_sp.* (new_sp_m04, new_sp_m514, etc.).
We are also using the untable command to remove an unwanted row that will match our pattern.
Finally we use a combination of the fillEmpty and filter commands to filter out null values. This is optional, in fact you might want these empty values in your results for analysis, or you may want to fill them with a different default and leave them in!
thaw tb
|| untable new_sp
|| melt new_sp.*
|| fillEmpty --filler "EMPTY"
|| filter "(value != 'EMPTY')"
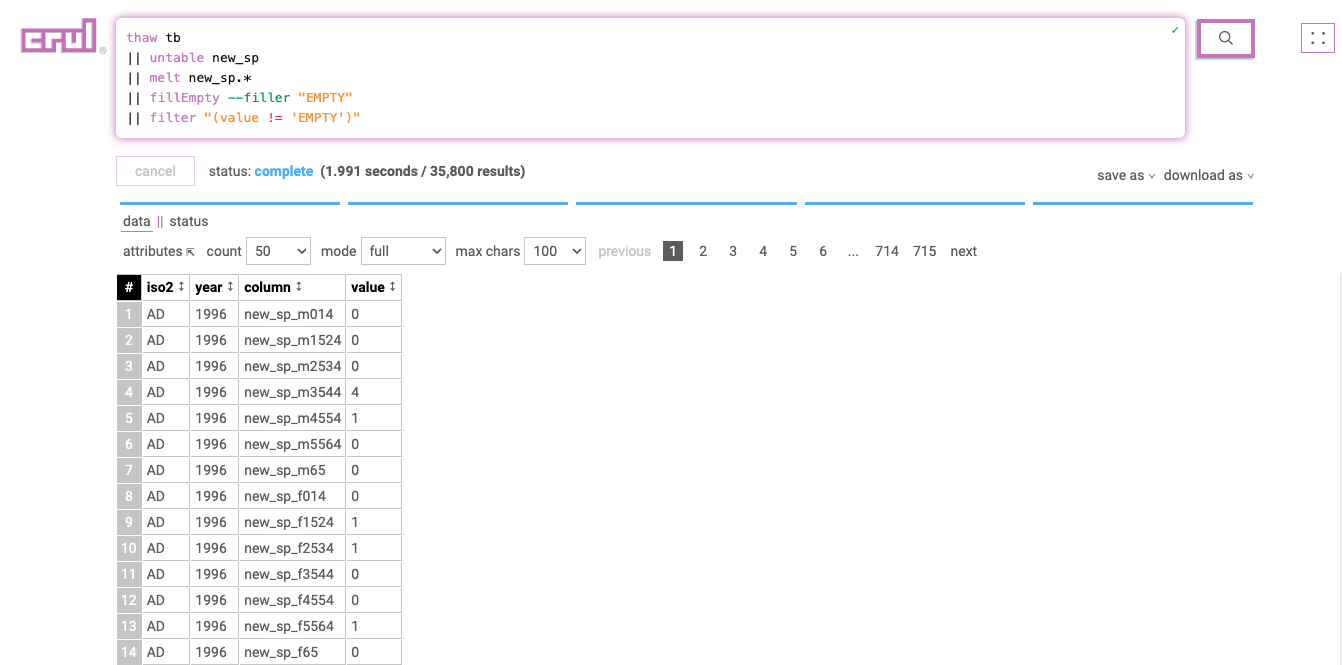
From here we can do a little more cleanup and renaming of columns, construct timestamps, or process otherwise, but our data is now effectively "molten".
Why use crul for tidy data?
The advantage of using crul for tidy data is the ability to both access the data and process it quickly in one place. Crul's caching tiers make it easy to iteratively design your dataset. You can also configure a schedule to automatically build data sets and optionally push them to one or more of 30+ common stores.
You can take advantage of other powerful commands in combination with the melt command. For example, incorporate semi-synthetic data generation with the synthesize command, incorporate prompting with the prompt command, or enrich/seed your data sets from web or API content with the open and api commands.
Happy melting!
Join our Community
Come hang out and ask us any questions.